UNH Healthcare Vitals: Sage Hospital Price Transparency Tool
Did You Know? New Hampshire’s acute care hospitals are all slightly different from one another, but now anyone can explore differences in how each hospital is paid and their quality scores through the new Sage Hospital Transparency Tool.
Here is the Latest: The Sage Transparency Tool is free, interactive, and now available online. Hosted by the Employers Forum of Indiana, the site provides transparent information about hospitals in New Hampshire and across the country.
The Sage Transparency Tool includes:
-
Hospital prices as a percentage of the Medicare rate – for example, if a hospital’s overall prices are 2.5 times what that same hospital would charge Medicare for the same services, the tool would express that hospital’s price as 250% of Medicare. See the Sage Transparency Tool for more explanation.
-
Breakeven analysis comparing what prices a hospital receives with what prices the hospital must receive to cover its costs, as explained by the National Academy for State Health Policy (NASHP) “breakeven price” metric.
-
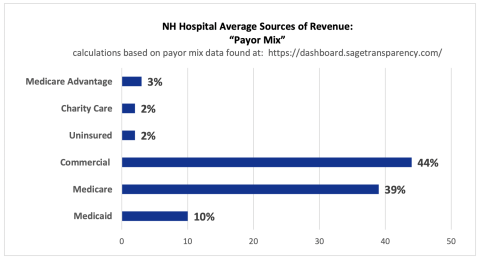
The percentage of revenues coming to each hospital by payor type, including Medicare, Medicare Advantage, Medicaid, commercial, charity care, and uninsured. See the NASHP “payer mix” metric on the Sage Transparency Tool.
-
Quality scores reflecting patient experience, overall performance, and proprietary clinical elements as analyzed by CMS, Healthcare Bluebook, and Quantros.
What does this mean for New Hampshire? This data can help us to understand our healthcare hospital delivery system: how and whether hospitals differ among communities and regions by their relative prices, their quality scores, and the sources of their revenue. For example, this information shows that relative hospital prices vary across New Hampshire. The amount of revenue earned from serving patients enrolled in commercial or public health insurance coverage also varies. This helps us understand where our healthcare hospital delivery system is vulnerable going forward.
The chart below shows that on average, New Hampshire hospitals receive about half their revenues from Medicare and Medicaid and about 2% from charity care. The individual hospitals vary significantly, however. The New Hampshire average for Medicaid revenue is 10%; the lowest percentage of revenue from Medicaid reported for any individual New Hampshire hospital was 0% and the highest was 20%. Conversely, although the state average for revenue from commercial health insurance coverage was 44%, the lowest reported for any hospital was 33% and the highest was 56%. The available data can foster needed dialogue about the relationship between price, cost, quality, and value for all regions of the state.